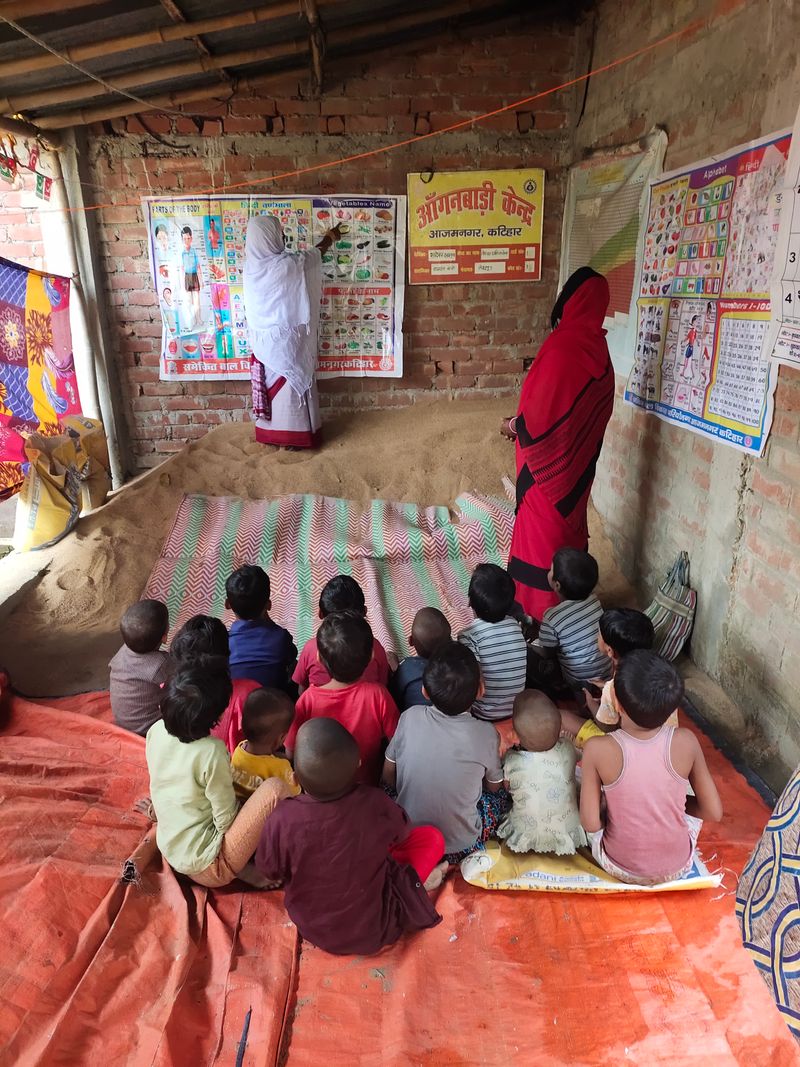
A student pointing to a map of India during a geography lesson in a classroom in Patiala, Punjab

03 — Flagship project

SLiCE — Statistical Literacy for Citizen Empowerment

Citizens are asked every day to interpret election surveys, healthcare statistics, economic indicators, climate data and AI-generated claims. Statistical reasoning remains one of the least developed competencies in school education.

Stage
Research
Geography
Geography to be confirmed
Partners
No partner announced
Domains

Lifecycle position

  1. 01

    Idea

  2. 02

    Research

  3. 03

    Pilot

  4. 04

    Implementation

  5. 05

    Measurement

  6. 06

    Knowledge Capture

  7. 07

    Publication

  8. 08

    Scaling

01 — Problem statement

What this project exists to address.

Modern society generates unprecedented amounts of data. Citizens are expected to interpret election surveys, healthcare statistics, economic indicators, climate data, financial information, scientific reports, AI-generated insights, social media analytics and business dashboards.

Yet statistical reasoning remains one of the least developed competencies in school education. As a result, many individuals struggle to distinguish evidence from opinion, probability from certainty, and correlation from causation.

Professor Arthur Benjamin has argued for the creation of a separate statistical track within school education, recognising that statistics is fundamentally different from traditional mathematics and increasingly essential to modern life. SLiCE extends that argument into a complete learning progression.

Inspiration

Statistical thinking will one day be as necessary for efficient citizenship as the ability to read and write.
H. G. Wells

02 — Objectives

What the project sets out to achieve.

  • 01Design India's first comprehensive school-level statistical literacy pathway spanning Classes 1 to 12
  • 02Integrate statistical thinking, data interpretation, probability, experimental design, visualisation, critical reasoning and evidence-based decision making into mainstream education
  • 03Prepare learners for higher education and careers, and for responsible participation in democratic society, scientific inquiry, public policy, entrepreneurship and an AI-enabled world
  • 04Provide the analytical foundation on which Process Excellence, root cause analysis and evidence-based decision making later depend

Conceptualised by

Deepak Dwivedi
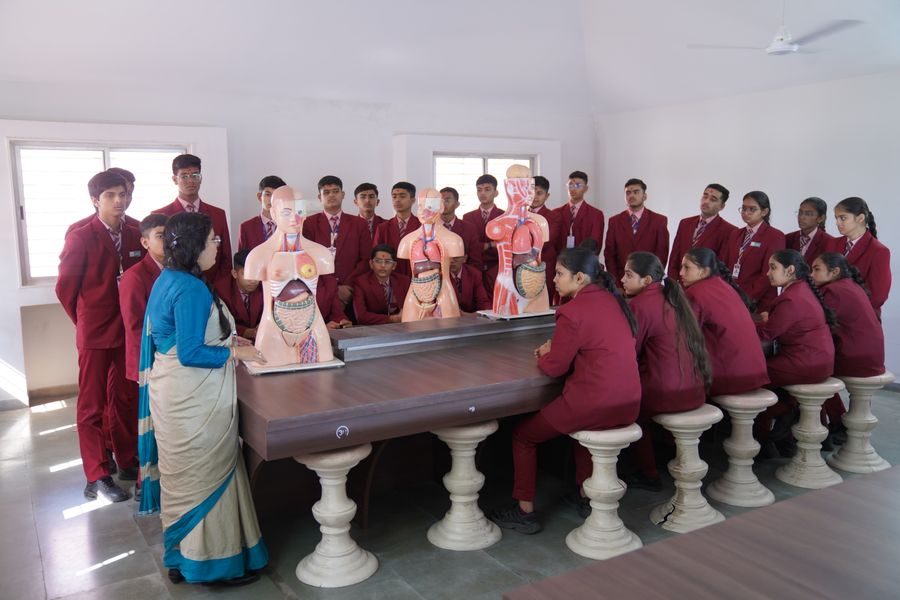
Students examining anatomical models during a biology class in Petlad, Gujarat

Petlad, Gujarat · Pexels

Target beneficiaries

  • School students, Classes 1 to 12
  • Teachers of mathematics and science
  • Schools and school systems
  • Teacher education institutions

03 — Programme structure

What the project is composed of.

  • 01

    Data Literacy and Observation

    Early years: noticing, classifying, measuring and recording.

  • 02

    Graphical Representation

    Reading and constructing representations of data honestly.

  • 03

    Probability and Sampling

    Understanding uncertainty and where a claim's evidence came from.

  • 04

    Experimental Design

    Designing a question that data can actually answer.

  • 05

    Statistical Inference

    Distinguishing what data supports from what it merely suggests.

  • 06

    Ethical Use of Data

    Recognising misuse, and understanding one's own responsibility as an interpreter.

04 — Activities

What is actually done.

  • Curriculum design for Classes 1 to 12
  • Teacher professional development programme
  • Student workbooks
  • Digital learning platform
  • AI-assisted learning tools
  • School statistical clubs

05 — Roadmap

The long-term programme.

  1. Curriculum for Classes 1–12

  2. Teacher Professional Development Programme

  3. Student Workbooks

  4. Digital Learning Platform

  5. AI-assisted Learning Tools

  6. School Statistical Clubs

  7. National Statistical Olympiad

  8. Statistical Literacy Certification Pathway

  9. Translation into all scheduled Indian languages

  10. Translation into leading international languages

  11. International collaboration with educators and statistical societies

06 — Measurement

How progress on this project will be judged.

These measures are defined before implementation, so that the project can be evaluated on its results rather than its activity.
  • Curriculum stages published
  • Teachers trained
  • Schools adopting the pathway
  • Students completing the certification pathway
  • Languages into which the curriculum has been translated

Awaiting publication

Impact data will be published as implementation progresses

The Council does not attribute outcomes to a project until they have been measured against a defined baseline. When results exist for this project, they will appear here and on the Impact page — including any that fall short of what was hoped for.

07 — Resources

Publications and downloads from this project.

The Knowledge Hub
  • SLiCE Curriculum FrameworkIn preparation
  • Statistical Literacy Progression MapIn preparation
  • Teacher HandbookIn preparation
  • Student WorkbooksIn preparation

Photographs and video

Awaiting publication

Programme photography

Documentation photography from this project will be published here, with the consent of participating institutions and in accordance with the Council’s Child Safeguarding Policy.

Awaiting publication

Recordings

Session recordings and explainers will be published in the media library as they become available.

Collaborate

Work with IPEC on SLiCE.

Institutions, government departments, CSR partners, researchers and volunteers all have a route into this work.

Partner with IPECContribute